Oven Temperature Uniformity: Mapping, Survey Points and What ±2°C Really Guarantees
Every industrial oven brochure quotes a uniformity figure: ±2 °C, sometimes ±1 °C. Buyers copy the number into comparison spreadsheets, and it quietly becomes a purchase criterion. Yet uniformity is the most misunderstood specification on the datasheet, because it is not a property of the oven alone — it is a property of the oven, a defined measurement procedure, a defined load, and a defined moment in time. A ±2 °C claim measured empty at one setpoint says very little about what your parts will experience on the top shelf of a fully loaded chamber at 150 °C with the door opened every ten minutes.
This article explains what temperature uniformity actually means, how a proper mapping survey is run, which factors silently destroy it in daily production, and how to build a quarterly mapping program that keeps the number on your datasheet true on your floor.
Why Uniformity Decides Process Outcomes
Thermal processes are specified at the part, not at the controller. A curing profile, a bake-out, an annealing step or a burn-in is defined as a temperature range that the product must experience for a defined time. The controller display shows the sensor reading at one point in the chamber; the product sits somewhere else. The gap between the worst spot in the working volume and the setpoint is exactly the margin your process window has to absorb.
Consider a coating cure qualified at 120 °C with a qualified range of 120 °C ±5 °C. If the chamber’s actual spread under load is ±2 °C, the process holds with margin to spare. If the spread drifts to ±6 °C because of a worn gasket and a rearranged rack, parts on the cold corner never fully cure and parts near the heater spend their life at the top of the range. Same setpoint, same controller, completely different process. This is why high-reliability sectors — aerospace pyrotechnics and composites, medical device curing, semiconductor packaging — treat uniformity surveys as qualification evidence rather than marketing claims.
Uniformity also interacts with ramping. During heat-up, spread is always wider than at soak, because airflow hits exposed surfaces before shielded ones. Processes that specify “time at temperature” need the soak phase measured separately from the ramp; a survey that only reports stabilized data will flatter the oven.
How a Uniformity Mapping Survey Works
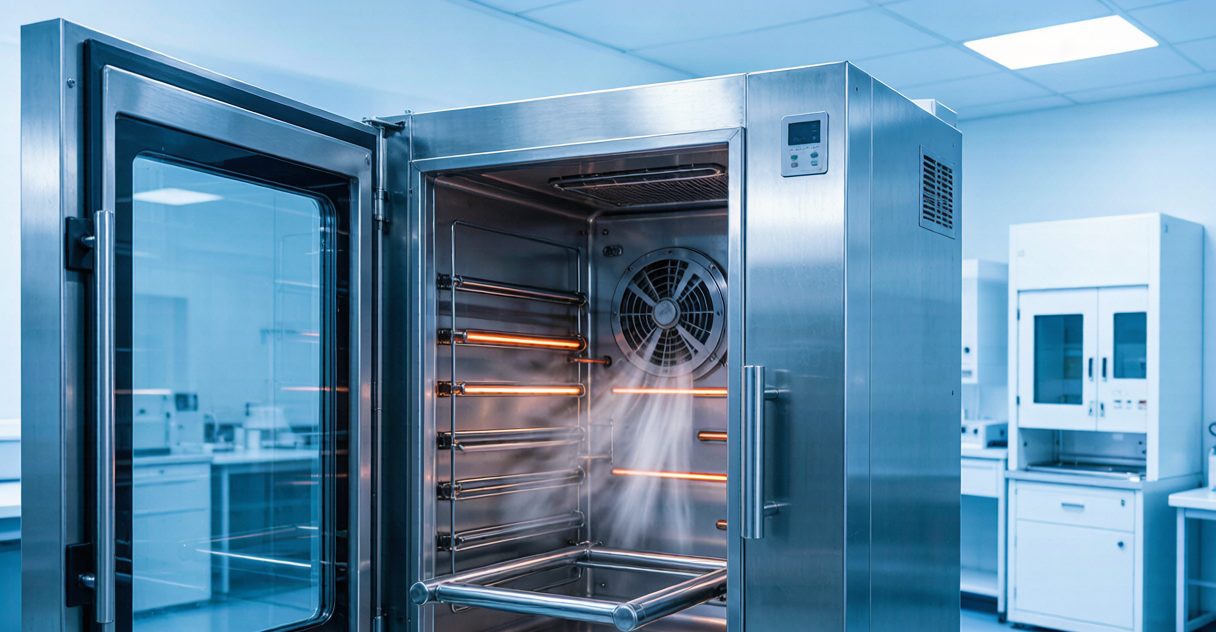
A mapping survey instruments the working volume with calibrated thermocouples at fixed points, then records every point simultaneously through a stabilization period and a soak window. The essentials:
- Survey points. Small chambers are commonly surveyed with a 9-point grid — eight points near the corners of the working volume plus one at geometric center. Larger chambers add mid-face points; a 15- or 27-point arrangement is typical for big cabinets and walk-in units. The corners matter most: they are farthest from the air source and always define the worst case.
- Reference standards. Aerospace programs follow AMS2750-style furnace class rules; general lab and industrial work usually follows the logic of IEC 60068 environmental testing, which requires measuring deviation across the working space at stabilization. Whatever the framework, the survey needs calibrated sensors, documented placement and a fixed sampling interval — one reading every 1 to 5 minutes over at least a 30–60 minute stabilized soak is a defensible default (treat these as indicative assumptions and tighten them to your own quality system).
- Loaded versus empty. An empty-chamber survey is a sanity check; a loaded survey is the truth. Map with a representative load — same mass, same rack, same shelf plan as production — because product mass changes airflow paths and thermal lag.
- Report the spread, not the average. The deliverable is the maximum positive and negative deviation from setpoint across all points during the soak window, per shelf and per time interval, plus the ramp behavior. A single averaged number hides the corner that matters.
What Degrades Uniformity in Daily Production
Between surveys, several quiet factors move the real-world spread away from the qualified one:
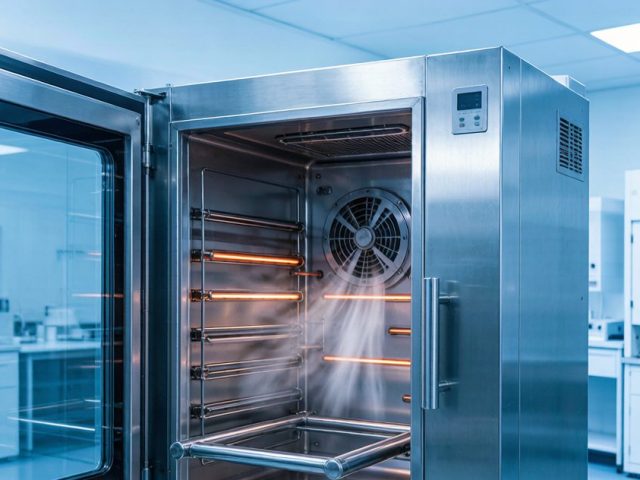
- Airflow design and blockage. Forced-convection ovens rely on a circulation circuit — blower, heater, distribution plenum, perforated side or rear walls. Loading that blocks return-air paths creates dead zones. Repositioning shelves or adding solid panels can shift the spread by several degrees.
- Door openings. Every door cycle dumps the chamber and re-enters room air; recovery time depends on heater power and PID response. High-frequency door traffic is the most common reason a survey-qualified ±2 °C becomes a production ±5 °C.
- Load mass and thermal lag. Heavy metal fixtures soak up heat and stretch recovery times. What matters is not the mass alone but how consistent it is between survey and production runs.
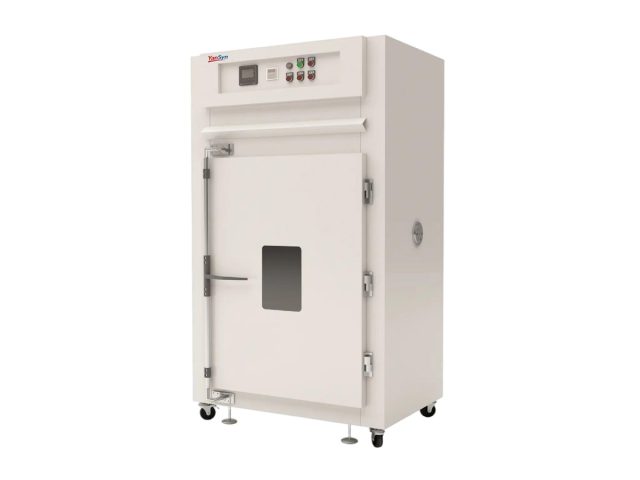
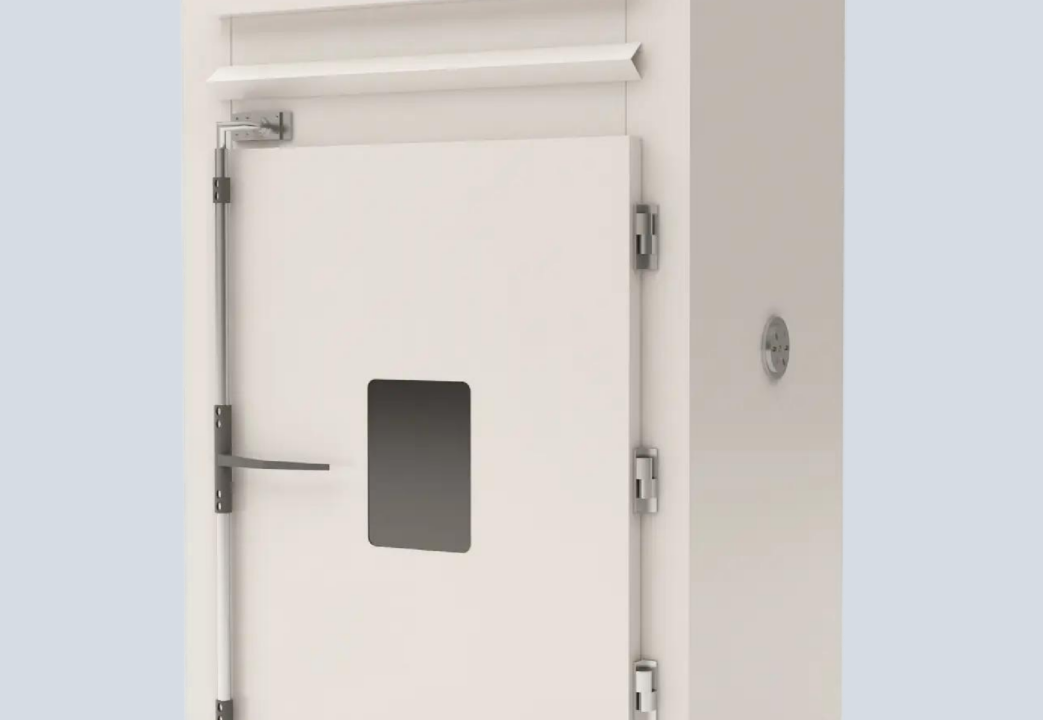
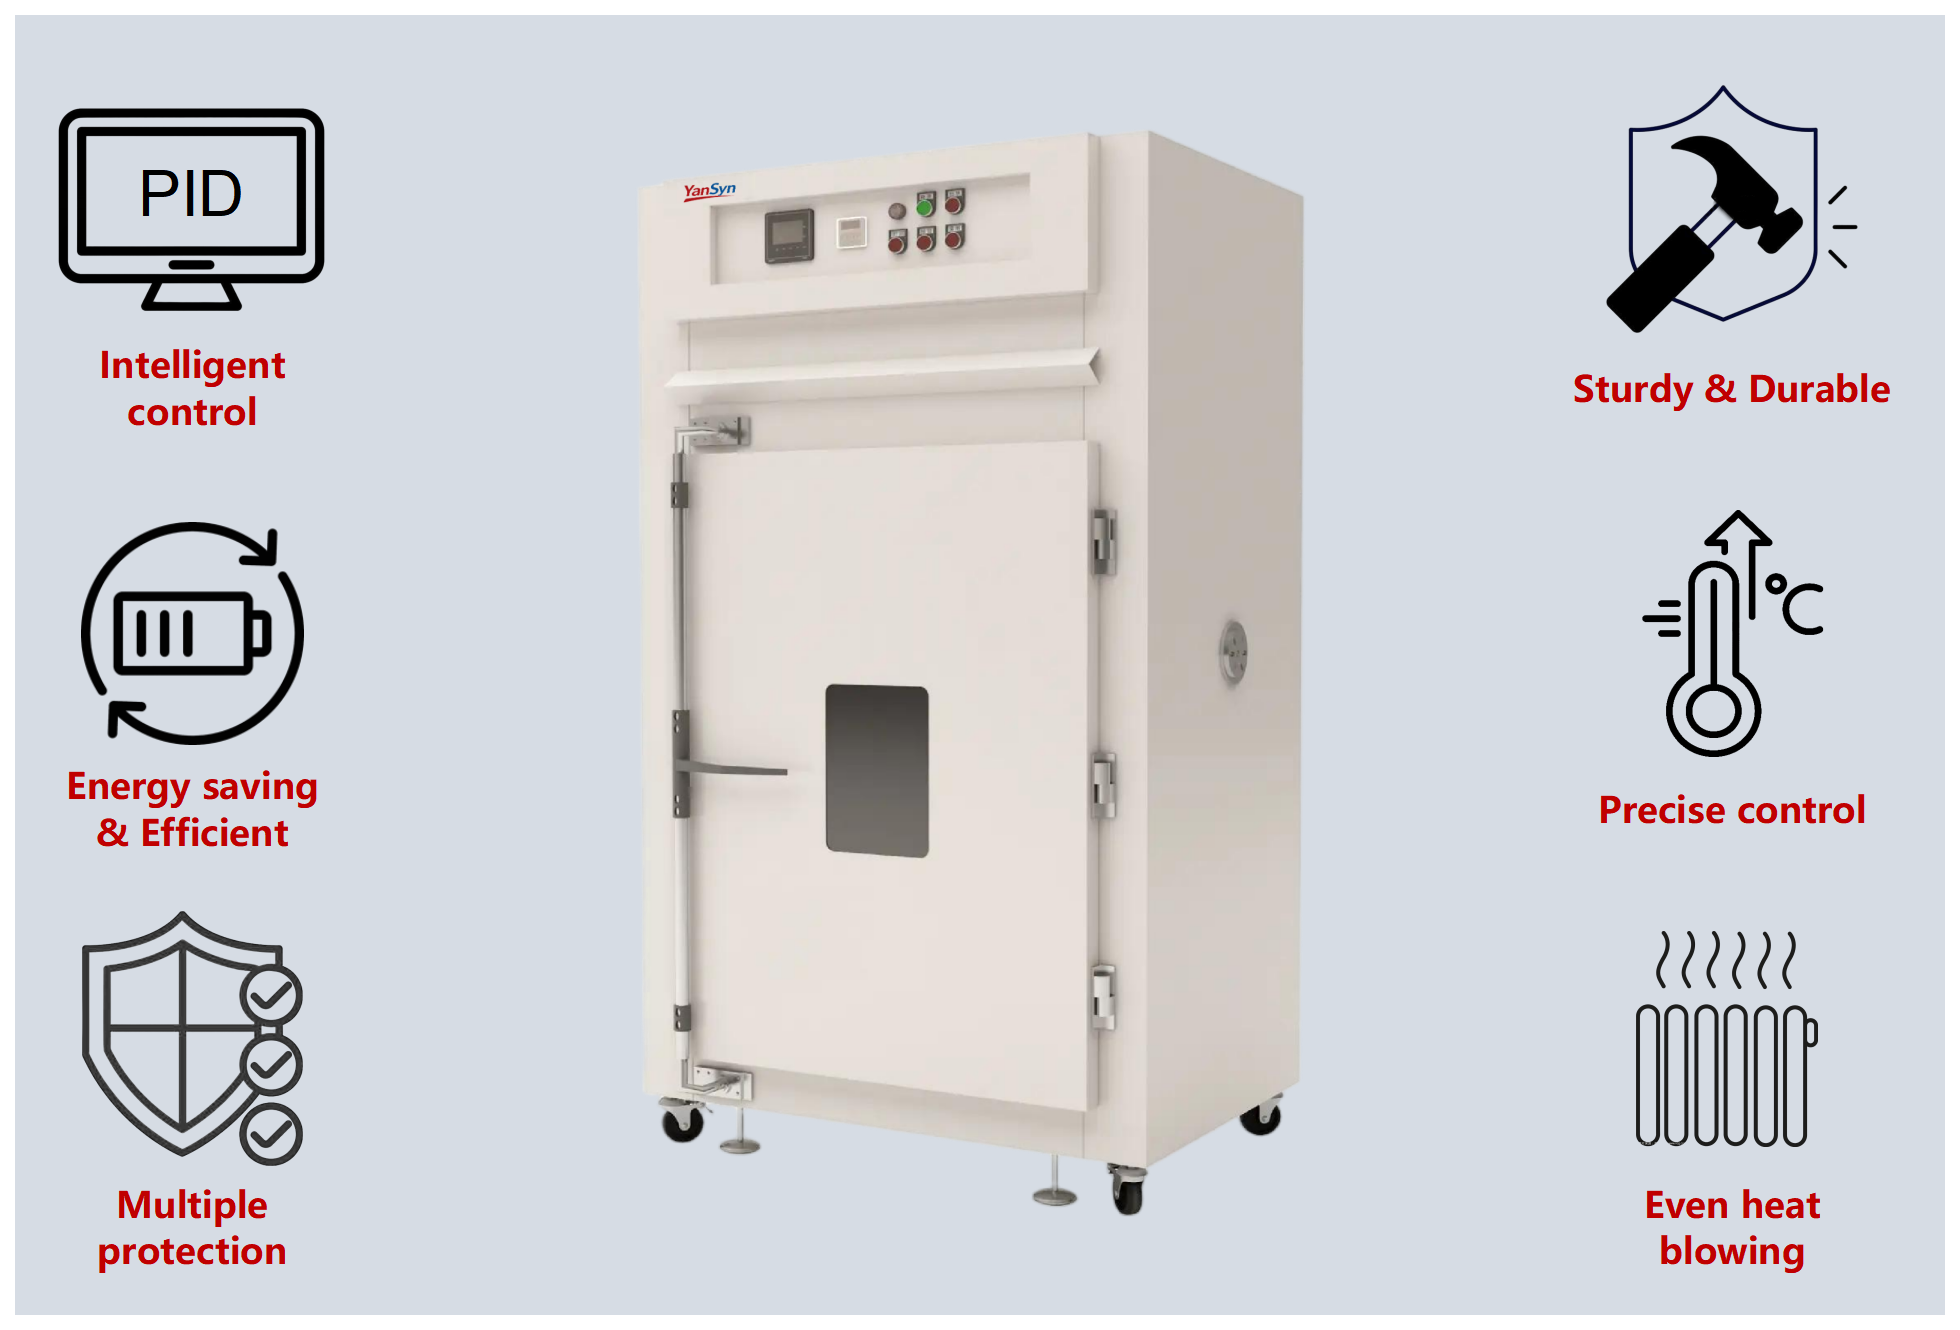
- PID tuning and sensor placement. A well-tuned PID with the control thermocouple in the right airstream holds tight windows; aggressive tuning overshoots, lazy tuning undershoots during recovery. This is where controller quality shows up — the YSHG industrial oven series pairs PID control with configurable ±2 °C (optional ±1 °C) uniformity targets across an RT to 500 °C range, and for wide or tall loads a YSHG 960 (960 L) keeps the survey grid within one air circuit instead of several dead zones.
- Wear items. Door gaskets, blower belts and heater elements age slowly and show up first as wider spread at the corners — which is precisely what a quarterly mapping program catches early.
Survey Conditions Compared
The table below summarizes how survey choices change what the uniformity number means, so engineering and quality teams can agree on definitions before comparing datasheets.
| Survey condition | What it measures | Typical use | Caveat |
|---|---|---|---|
| Empty chamber, stabilized | Best-case hardware capability | Acceptance test, datasheet verification | Says little about production reality |
| Representative load, stabilized | Real soak spread under production-like conditions | Process qualification, audit evidence | Valid only for that load pattern and shelf plan |
| Loaded, incl. ramp and door recovery | Worst-case behavior through transients | High-frequency door traffic, thick loads | Needs longer logging and more analysis |
| Multi-point quarterly re-survey | Drift trend of hardware and wear items | Ongoing quality programs | Must use fixed points to make trends comparable |
A Quarterly Mapping Program You Can Actually Run
A practical program needs neither a shutdown nor a consultant visit for most cabinet-class ovens:
- Fix the recipe. Document setpoints, shelf plan, load mass and door policy for each process the oven serves. Mapping without a fixed recipe produces numbers you cannot compare next quarter.
- Instrument a fixed grid. Permanently label 9 (or 15) survey positions in the working volume and use the same calibrated channels every time. Consistency of placement is what turns a survey into a trend.
- Log the soak. Run a representative load at the production setpoint, log every point for 30–60 minutes after stabilization, and compute the max/min deviation per point.
- Flag, then investigate. If the spread exceeds your qualified limit, check in order: door gasket, airflow blockage, blower condition, PID response during a door-recovery step. Wear items almost always explain a slow widening trend.
- Archive the evidence. Keep plots with dates, sensor serials and load descriptions. When a customer or auditor asks how you know your cure actually happened in range, this file is the answer.
Uniformity is one of several specification traps when comparing ovens; our buyer’s guide to clean ovens covers the adjacent pitfalls of HEPA filtration and outgassing in how to specify a clean oven, and the general trade-offs between chamber classes are laid out in clean oven vs high-temperature oven.
FAQ
Is ±2 °C uniformity guaranteed for every setpoint?
No vendor can promise identical spread across the full range from ambient to 500 °C; spread characteristics differ at low temperatures, where heater modulation is coarser, versus mid-range soaks. Treat a datasheet figure as a design target verified at stated conditions, and confirm it by mapping at your actual setpoints. (All figures here are indicative assumptions unless validated on your unit.)
How many survey points do we need for a 240 L bench cabinet?
A 9-point grid is a sensible default for cabinet-class volumes: eight points near the working-volume corners plus the center. Go to 15 points when the load plan leaves large unblocked sub-volumes, or when a customer spec demands it.
Our survey passed but parts still fail at the top shelf. What first?
Re-run the survey with the actual production load and shelf plan. The most frequent root cause is a load pattern that differs from the survey configuration — a solid tray, an added fixture, or a filled top shelf that redirects the air path.
Can we improve uniformity without buying a new oven?
Often yes, within limits: enforce a door-opening policy, switch to perforated trays, verify gasket and blower condition, and have the PID retuned for your typical load. If the spread remains wide after these, the airflow architecture itself is the limit — that is a hardware property, not a tuning issue.
Conclusion
A uniformity specification is a promise about your parts, and it is only credible when it is tied to a defined survey: fixed points, calibrated sensors, a representative load, and a soak window long enough to be honest. Specify ovens with uniformity targets matched to your process window, verify them with a loaded mapping survey at your setpoints, and re-survey quarterly to catch drift before it becomes scrap. For ovens that pair PID control with ±2 °C (optional ±1 °C) uniformity targets and RT to 500 °C range — with optional Class 100 filtration, nitrogen purge and IoT monitoring — explore the YSHG 240 industrial drying oven or contact the YanSyn team with your process window and load plan, and we will help you size and map the right chamber.